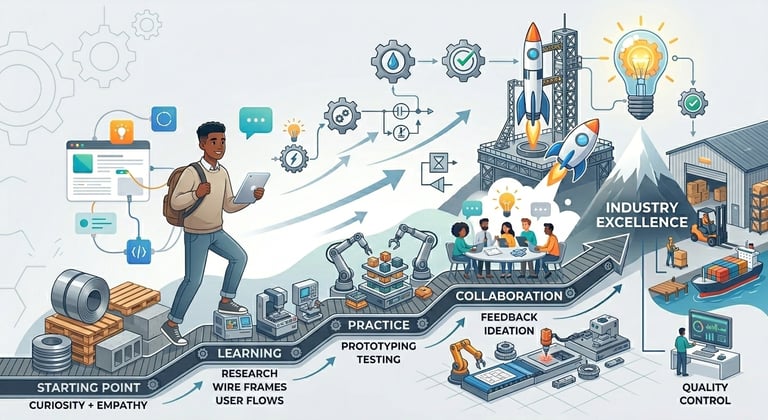
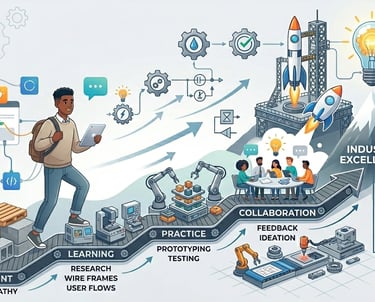
The AI Black Box
UX-driven research project dedicated to bridging the "trust gap" in industrial Artificial Intelligence. Unlike traditional AI development which focuses solely on algorithms, this project treats User Experience as the missing link in high-stakes environments like supply chains and manufacturing.


Read Time
Timeline
70 Minutes
Jun 2025 - Jan 2026
Types of AI Machine Learning
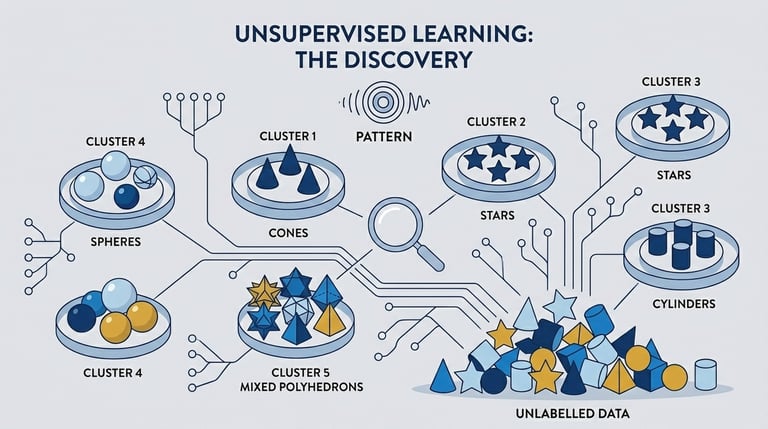
Unsupervised
The algorithm analyzes internal structure and mathematical distribution of the data.
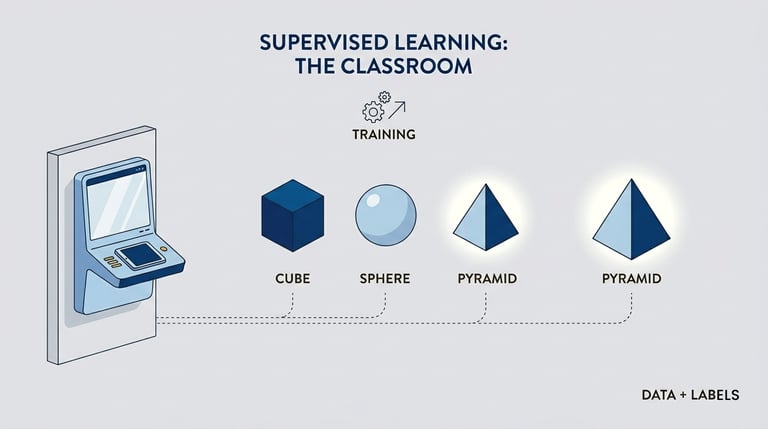
Supervised
The algorithm learns direct mapping function between the input and the result.
Project Focus
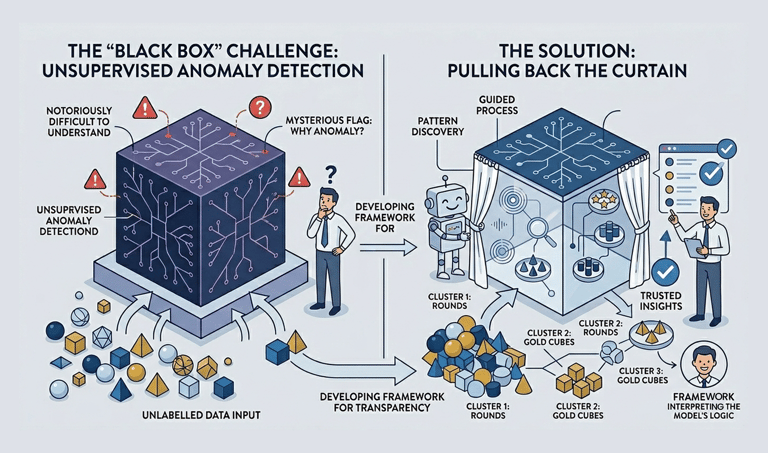
In Machine Learning. Supervised models offer a clear path to results because they rely on predefined answers. however, unsupervised Learning remains a "Black Box" a Challenge where it is notoriously difficult for users to understand why a specific anomaly was flagged.
My project embraces this challenge by focusing on Unsupervised Learning, specifically aiming to pull back the curtain on its complexity. I am developing a framework that translates these 'Black Box' outputs into transparent, intuitive insights that even a non technical stakeholder can trust and understand.
Unsupervised
Anomaly Detection
The Topic
Why
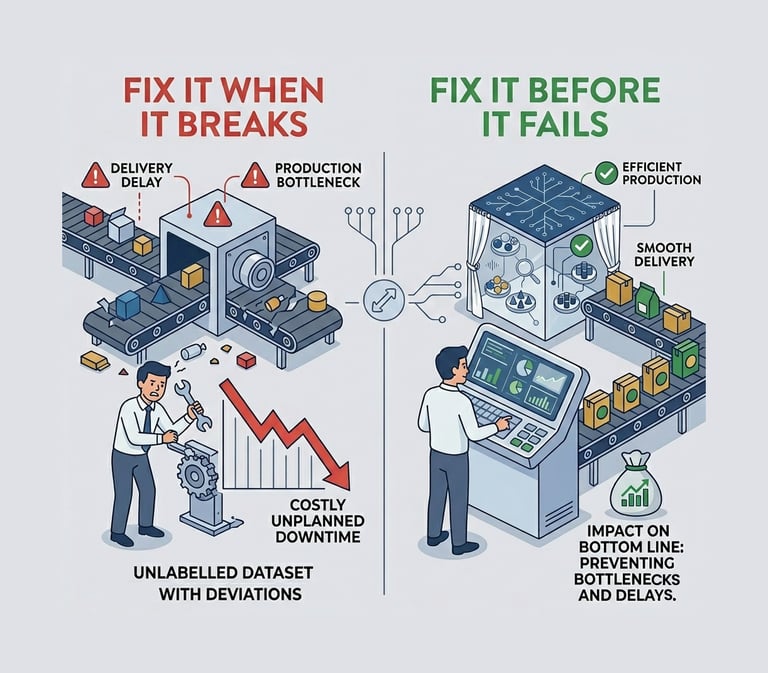
Reducing unplnned downtime in the supply chain directly impacts the bottom line by preventing production bottlenecks aand delivery delays. Moving away from "fix it when it breaks" (which is costly and disruptive) to "fix it before it fails"
What
Anomalies are data points that stand out amongst other data points in the dataset and not confirm the normal behavior in the data. This data points or observation deviate from the dataset's normal behavior patterns
Predictiveness
Monitoring Anomaly Detection (Proactive)
60%
Anticipatory / Recommendation / Personalization
30%
10%
Automating Actions
Project Focus
The Stakes
Bhopal Disaster


Background Examples
Warnings were ignored, safety systems were disabled, and catastrophic delays ensued not due to lack of data, but a tragic failure of system
The Trigger Anomaly: High pressure and temperature inside tank E610, far exceeding safe limits
Alarm Fatigue: The primary pressure alarms were known to frequently sound false warnings, leading operators to ignore or silence them routinely


Motivation
Why UX is the Missing Link
2.
Operators often override or ignore poorly explained alerts, leading to delayed or incorrect decisions.
3.
User experience has been neglected in the "last mile" intelligence delivery layer
1.
Trust and transparency are critical safety enablers in high stakes environments.
Overall Problem Statement
Users cannot easily choose which data to include or define specific timeframes for analysis (CRUD and Configuration).
Lack of Control
The "Data Mystery"
There is no guidance or "hints" to help non experts select the right sensor data to train an effective model
Short title
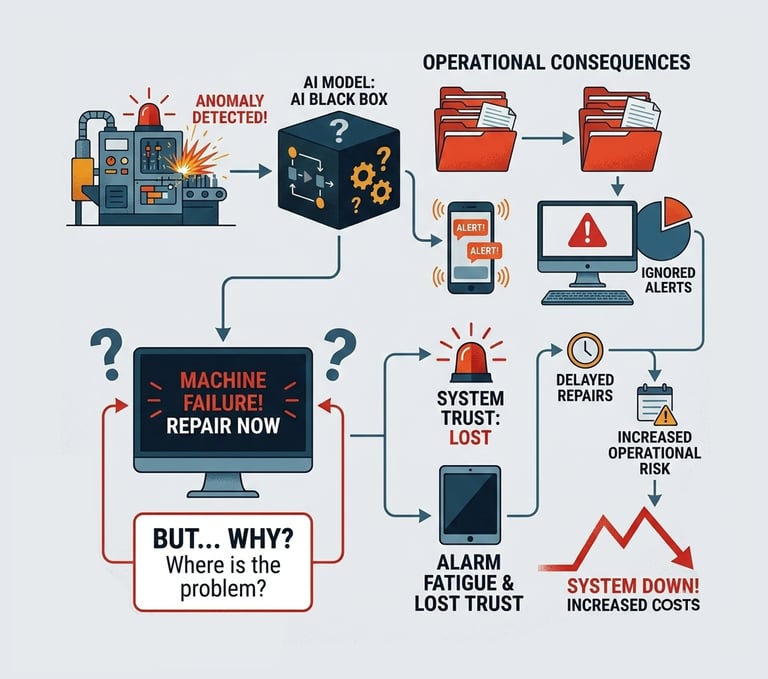
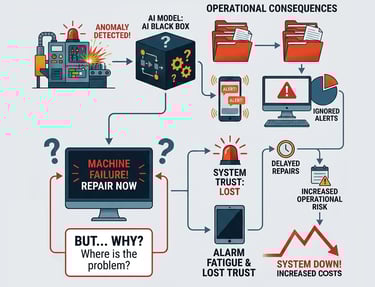
In modern industrial settings, Anomaly Detection is vital for keeping assets running. However, most systems fail because their AI models are "Black Boxes" they tell a maintenance engineer that something is wrong, but never why.
When engineers don't understand the "WHY," they experience alarm fatigue and lose trust in the system. This leads to ignored alerts, delayed repairs, and increased operational risk.
The Trust Gap
Engineers have no clear way to validate results, making it impossible to distinguish between a real machine failure and simple data "noise"
Static Models
Systems often fail to update as machine conditions change, making the AI's insights outdated almost immediately.
Insights often stay stuck in a dashboard rather than automatically triggering a "Closed Loop" action (like a Work Order) in the System
Broken Loops
Pain Points
Based on the Discovery workshop on the existing features
Goal and Scope
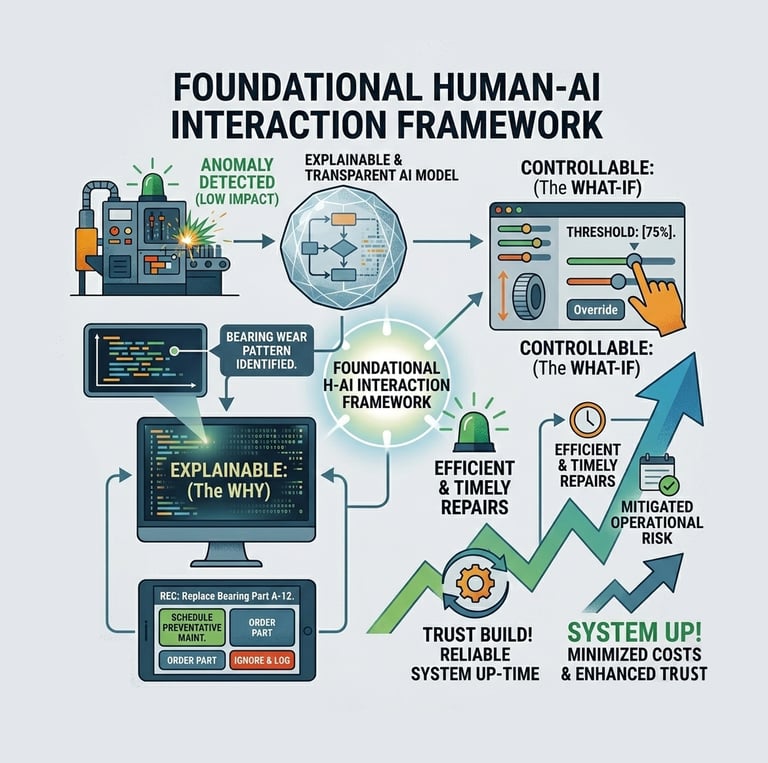
The core goal is to define, prototype and validate a foundational Human AI Interaction Framework that can build user trust in automated systems. To pioneer a human centered design approach that makes AI explainable, Controllable and Actionable
Universal Impact
This research is designed to go beyond the supply chain. the resulting AI Experience (AIX) patterns are domain agnostic, providing a blueprint for transparency and trust in any high stakes field, form industrial assets to medical diagnostic and scientific data analysis
Critically, this research is designed to cover the entire operational journey
From the initial design and creation of the model > review the model > feedback > retrain > use the Model > feedback > Retrain > Continuous use of feedback. this establishes a truly End-to-End, Closed loop system.
Testbed
We use APM as the rich, high stakes testing ground, working with multi modal data (sensor, visual, reports) and real world operational experts.
The Human-Centered AI Trust Loop
The Project is organized around the three critical phases of human interaction with an anomaly detection system
Control in Model Creation
and Configuration

Trust in Decision Review
Automation & Continuous Learning


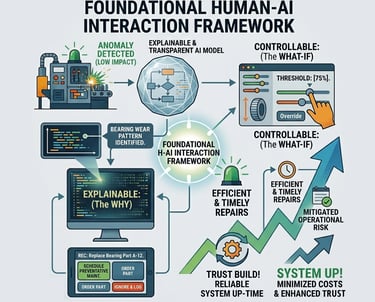
Control in Model Creation & Configuration
Explainable Setup
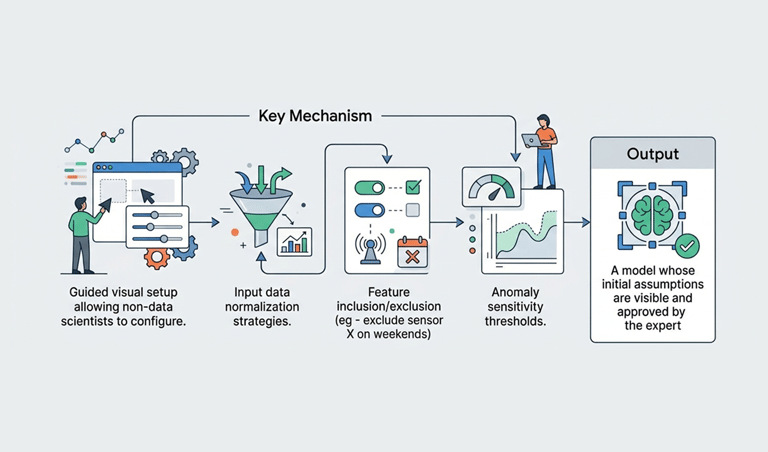
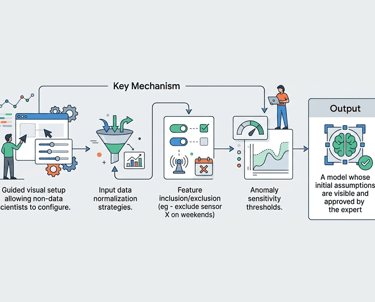
Key Mechanism
Guided visual setup allowing non-data scientists to configure.
Output
A model whose initial assumptions are visible and approved by the expert
Why it matters
Users trust what they help build and understand.
Input data normalization strategies.
Feature inclusion/exclusion (eg - exclude sensor X on weekends)
Anomaly sensitivity thresholds.
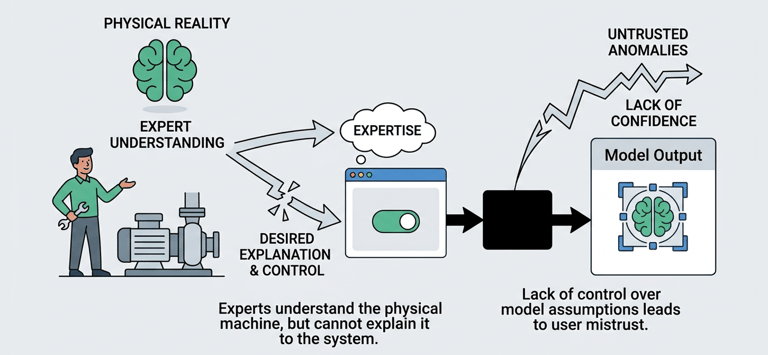
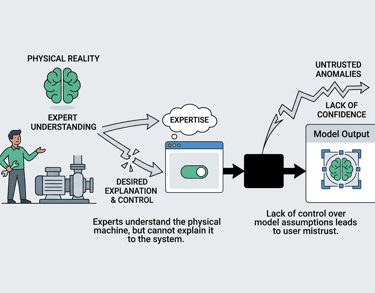
Problem Statement
The maintenance expert understands the machine’s "physical reality," but the system lacks the flexibility to let them translate that expertise into the AI model.
This creates a fundamental "Configuration Gap": if an engineer cannot easily control what goes into the model, they will never trust the anomalies that come out of it.
Pain Points
Data preparation is a HUGE and exhausting task. Manually cleaning sensor data, aligning timestamps, and filtering out "noise" (like when a machine is turned off for maintenance) can take weeks of manual effort.
The Data prep "Mountain":
The Selection Paradox:
Engineers often don't know which specific sensors (temperature, vibration, pressure) the AI needs to see to be effective. Without "hints," they are just guessing.
Users often cannot easily Create, Update, or Delete specific data inputs. If a sensor breaks or is replaced, the model becomes obsolete because the user lacks the control to adjust the configuration on the fly.
Lack of CRUD Flexibility:
Industrial assets change over time. Being unable to easily define when a machine was "healthy" vs. when it was "unstable" leads to models trained on bad data.
Fixed Timeframes:
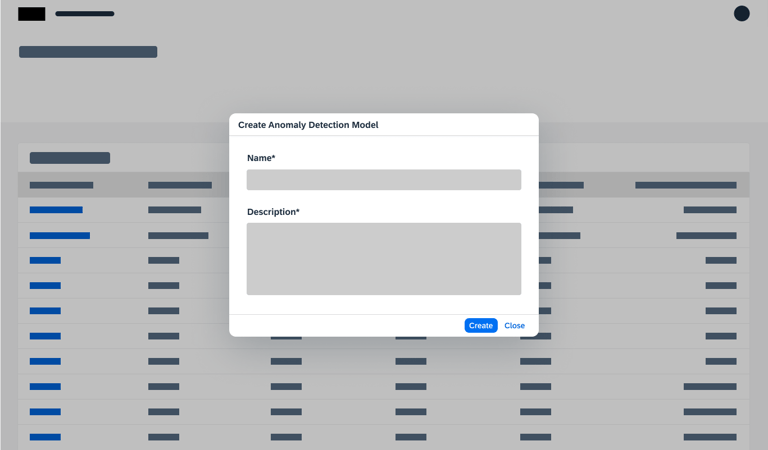
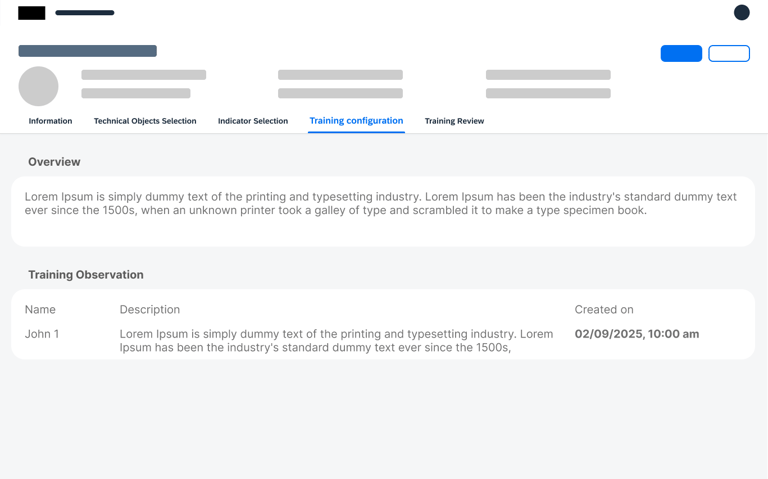
User Flow
Wireframe and concept for validation

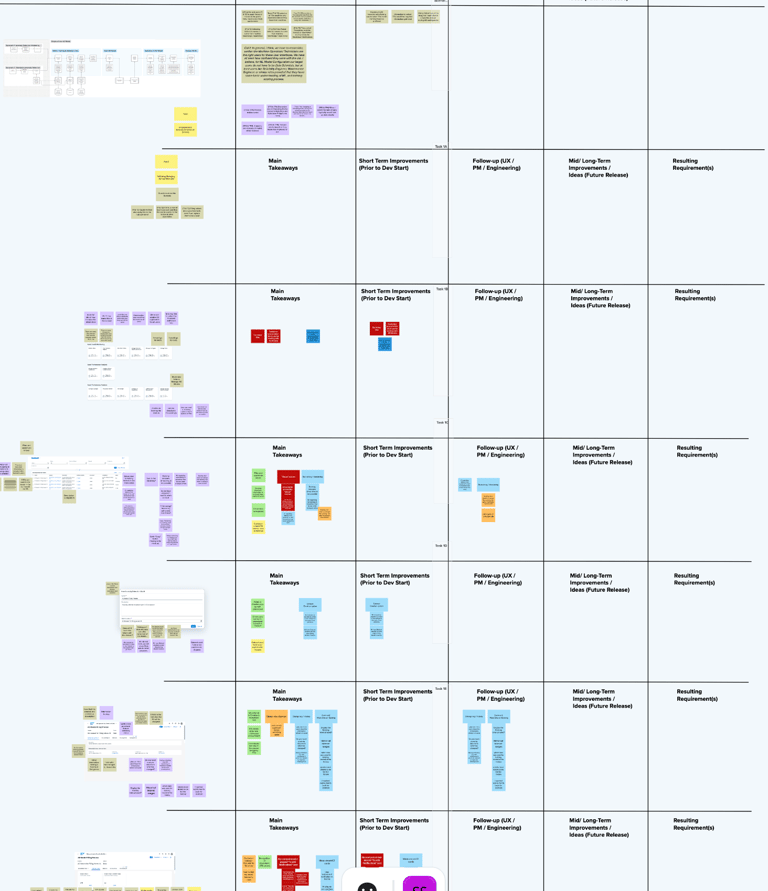
Research interview and Insights
To validate the effectiveness and efficiency of the designs for the APM Manage Anomaly Detection Models app, and evaluate its ease of use and user satisfaction while using the app.
Goal:
Expectation:
The results of this research will clarify the task flow(s), pain points, ideas the end user expects for the app. With this information we will be able to better improve the solution we’re planning to build.
As a Reliability Engineer / Maintenance Planner, I want to set up, train and review a model for anomaly detection. Since I am not a data scientist, the setup should be simple, yet with an accurate output.
Scenario:
All related to creating, training, and reviewing a model, from start to finish through all of its aspects.
Tasks:
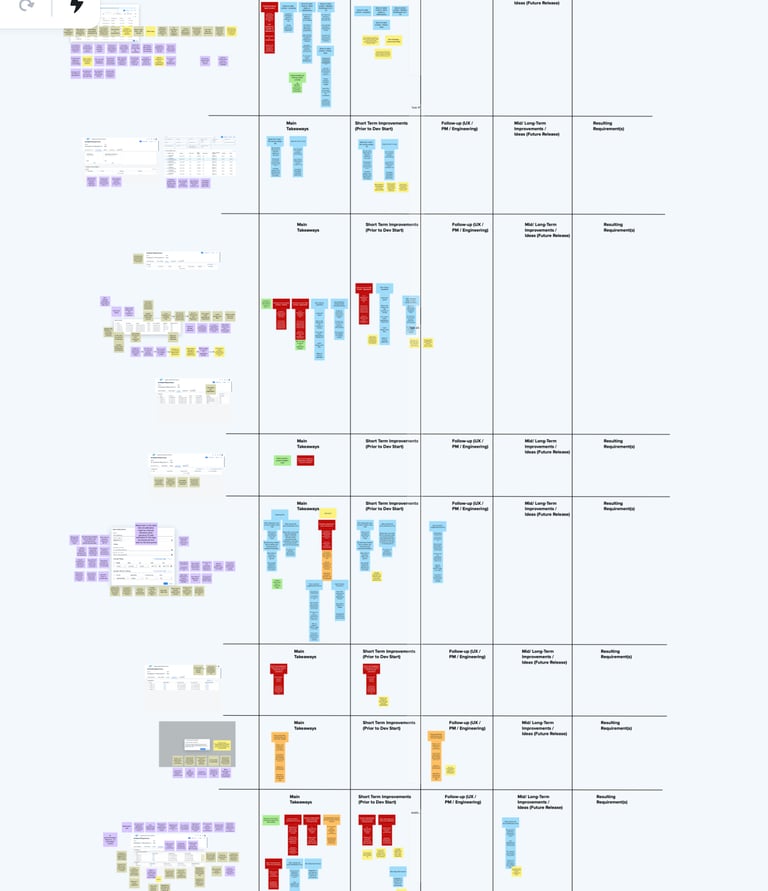
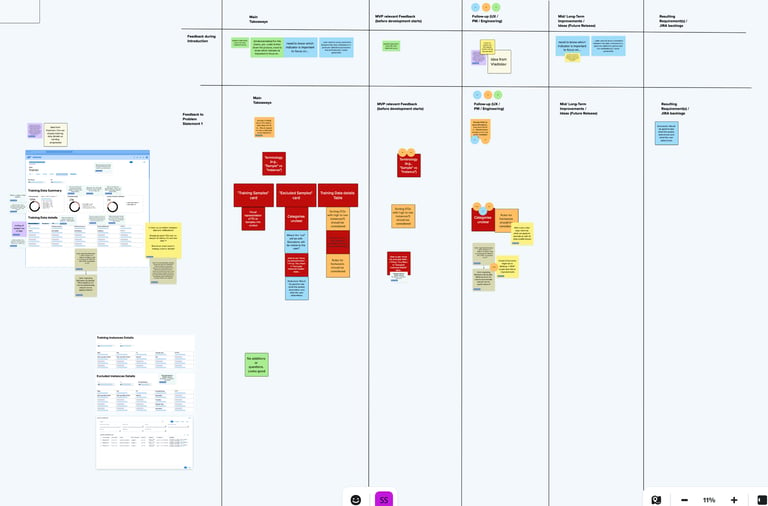
Feedback Prioritization
Received a Positive feedback for our new approach and freedom what end user is getting is really very well accepted.
Segregating insights for short term, mid term and Long term
Creation and Configure flow
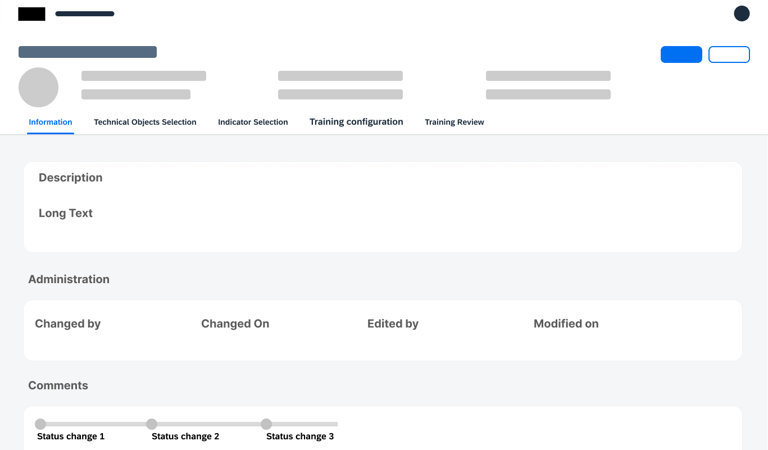
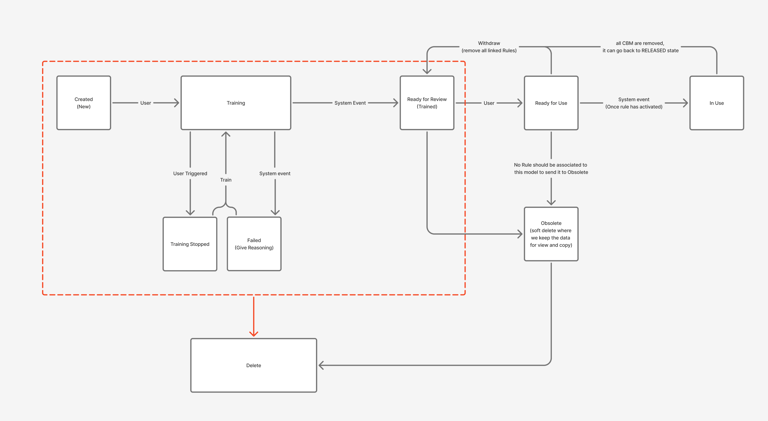
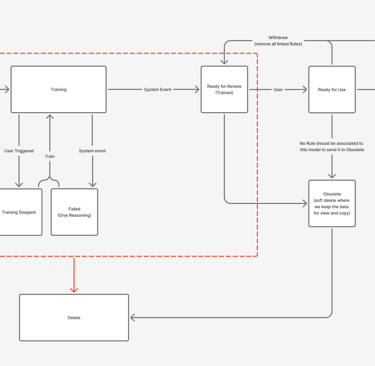
Status Management
View the video on full screen
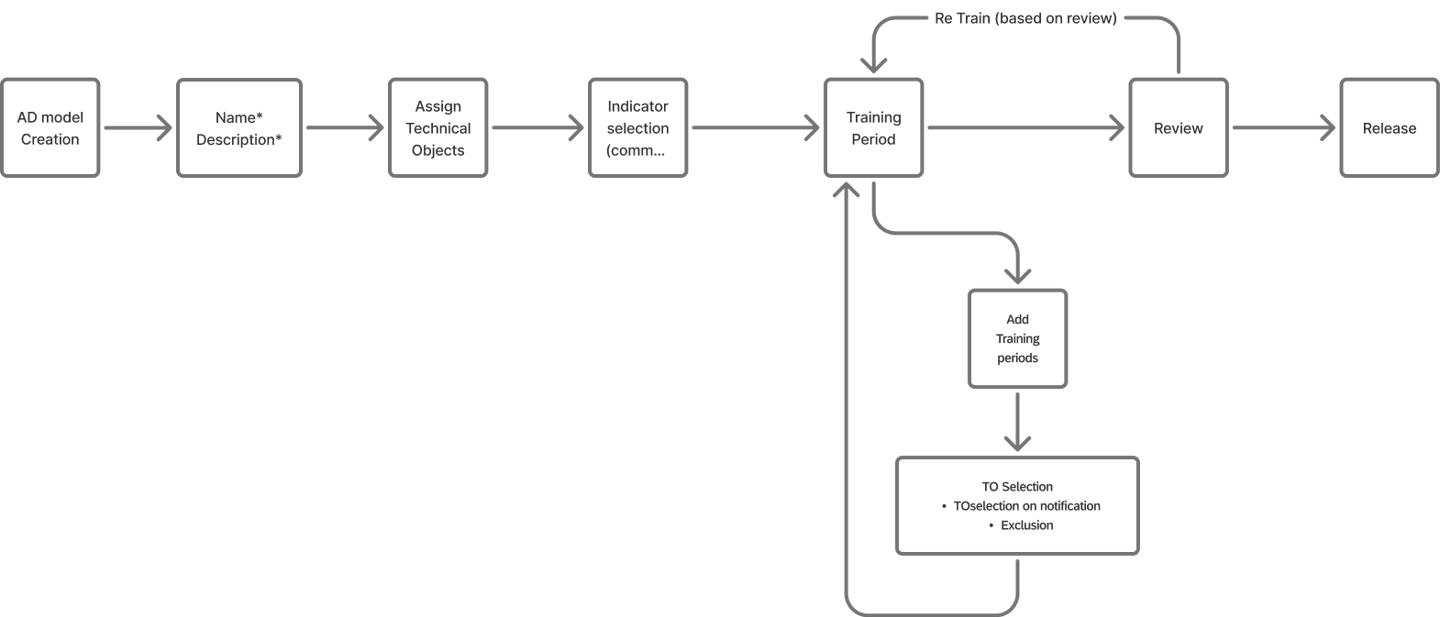
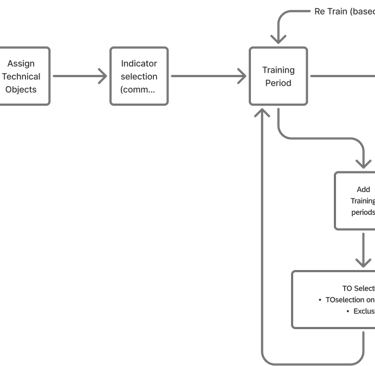
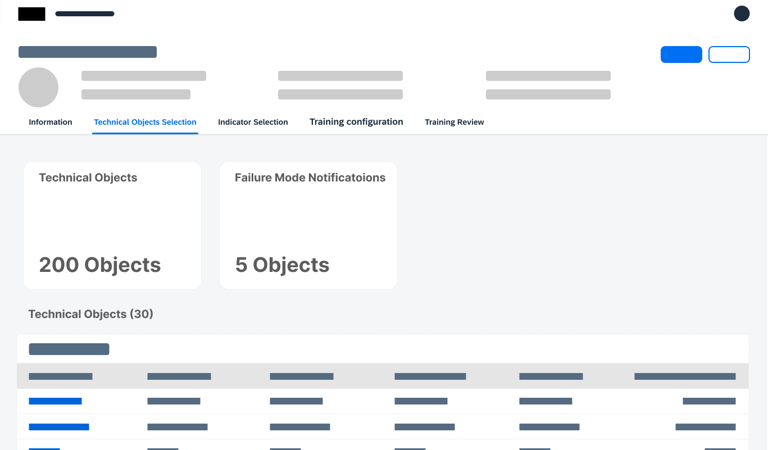
Adding Objects
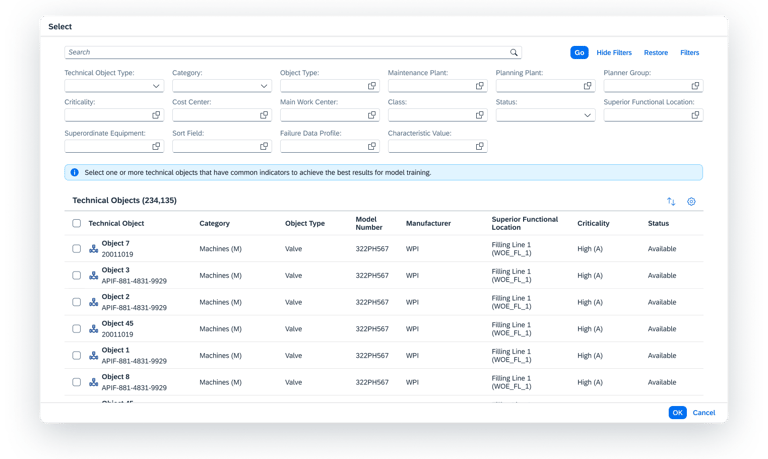
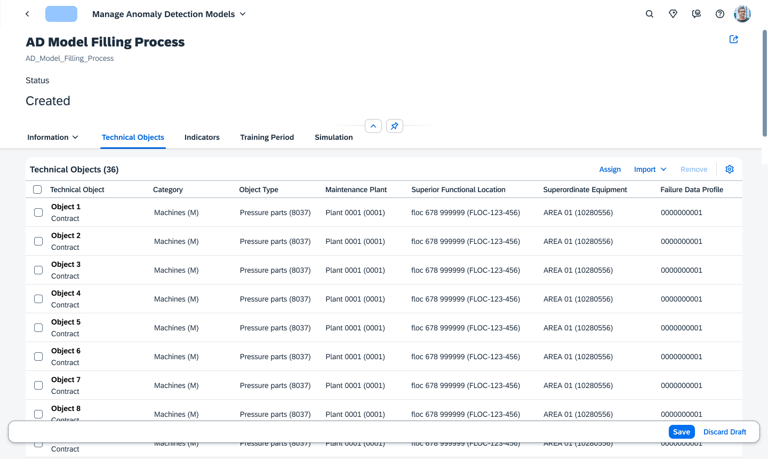
Before training can begin, the user must define the "boundaries" of the model.
Users select or import only the specific equipment or components they wish to monitor.
To reduce noise and clutter, the system only displays objects within the user's specific area of responsibility, ensuring they stay focused on the assets they manage.
Precision Targeting
Role Based Clarity
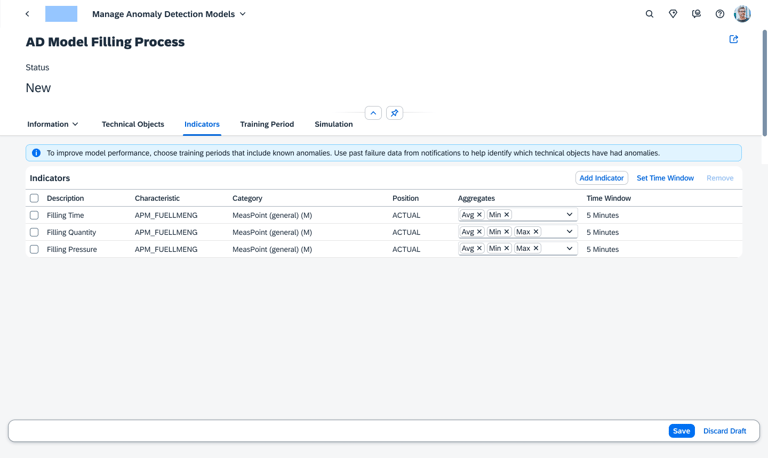
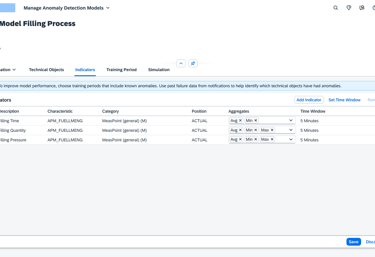
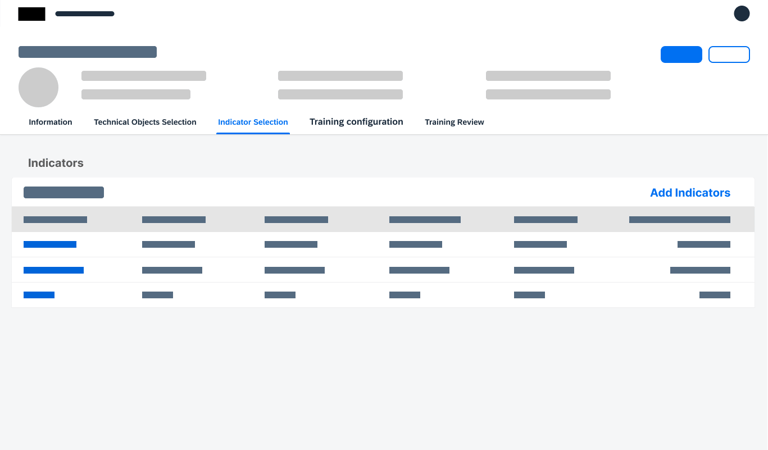
Choosing Indicators
Once the objects are set, the user identifies the specific "sensors" or data points (Indicators) that the AI should analyze.
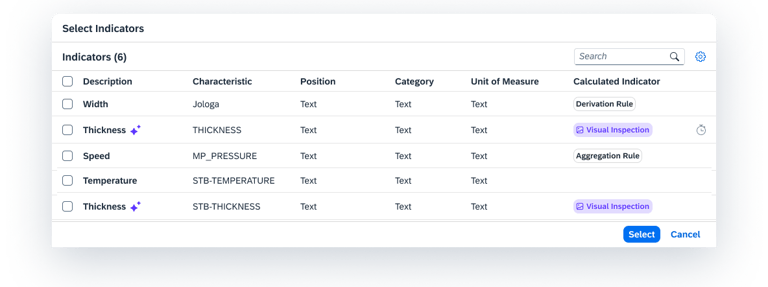
Users select common indicators and define how that data is summarized (Aggregation).
To ensure the AI processes data consistently, users set a Default Time Window (e.g., every 5 minutes), creating a synchronized heartbeat for all sensors across the model.
Standardized Learning
Unified Rhythm
Configuring
Effective AI needs to understand what "Healthy" looks like. In this stage, the user creates one or more historical benchmarks.
Users review historical time-series data to identify specific periods in the machine's life when it was performing optimally.
This allows for the creation of multiple reference points, ensuring the model has a robust understanding of operational history.
Timeline Analysis
Flexible Windows
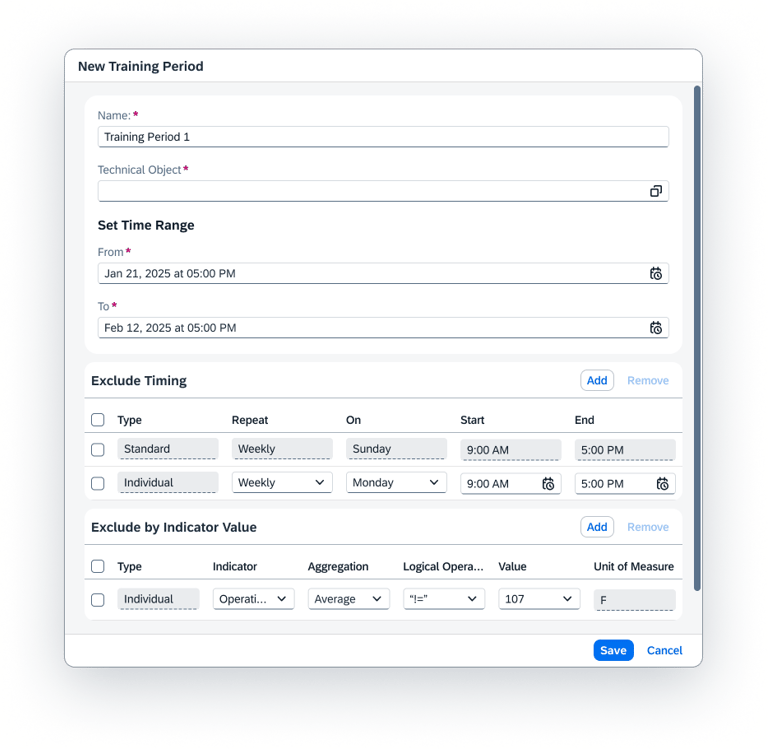
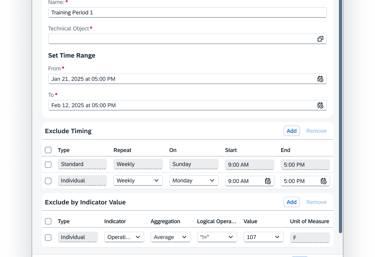
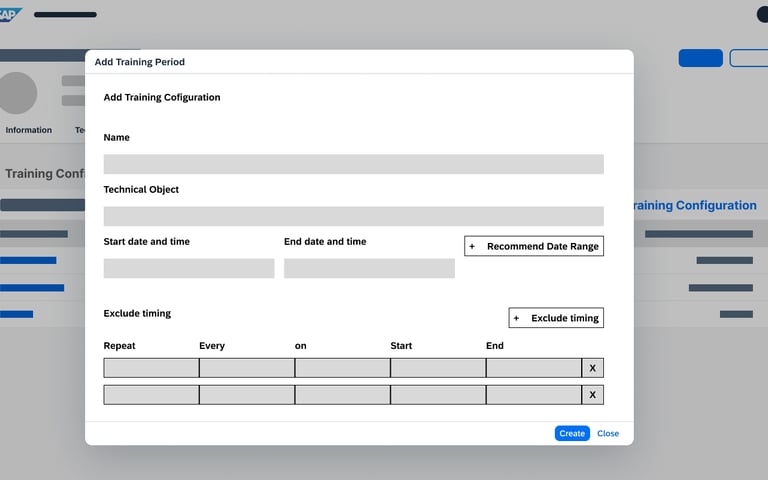
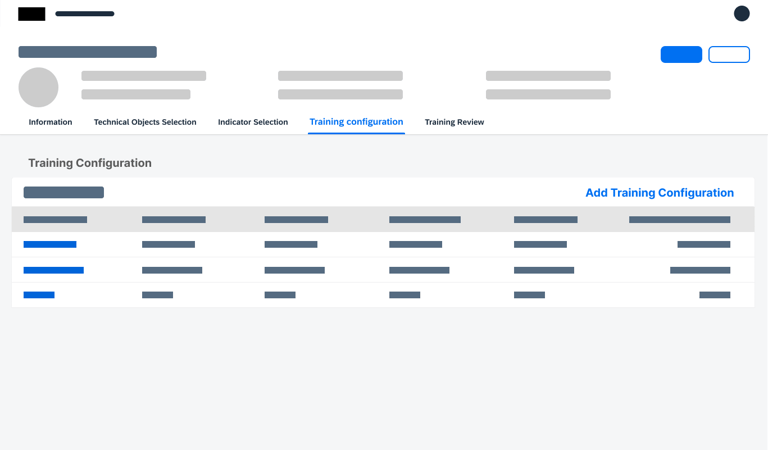
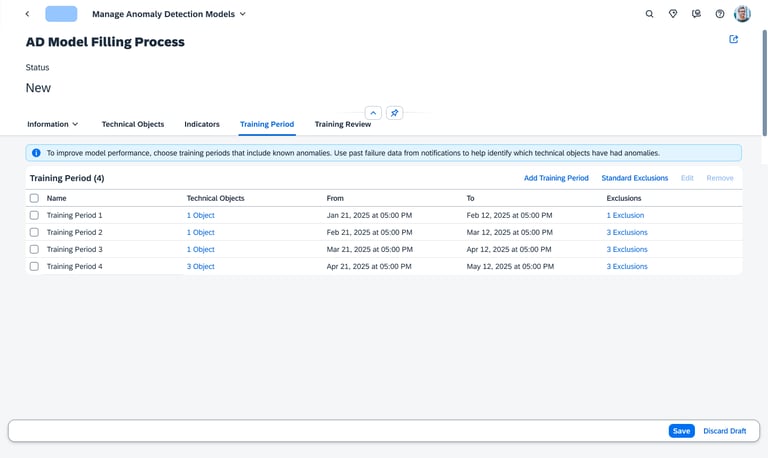
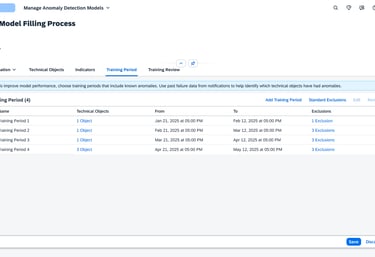
Defining Training
The final step is the "Fine-Tuning" of the training engine. Here, the user connects the Objects to the Timeframes.
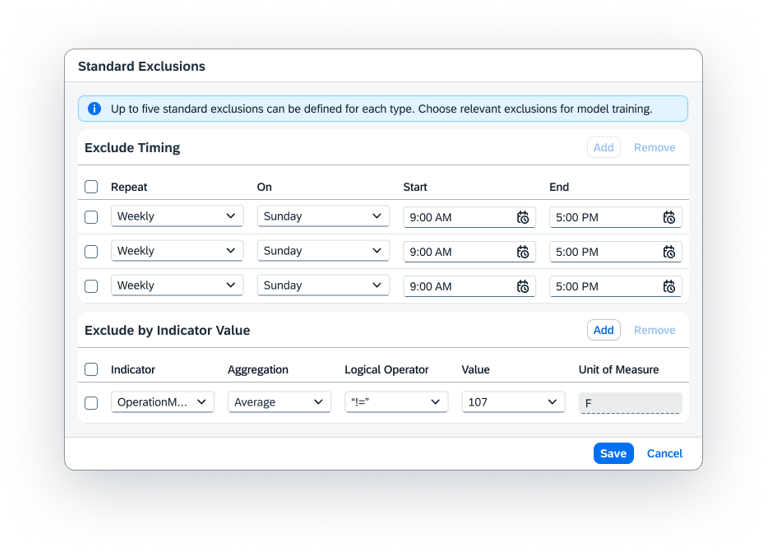
The user picks which specific objects should be trained on which specific dates.
To prevent the AI from learning "bad habits," users can manually exclude specific times such as Sundays, maintenance downtimes, or holiday shifts ensuring the model is only built on "pure" operational data.
Selective Training
Clean Data Exclusion
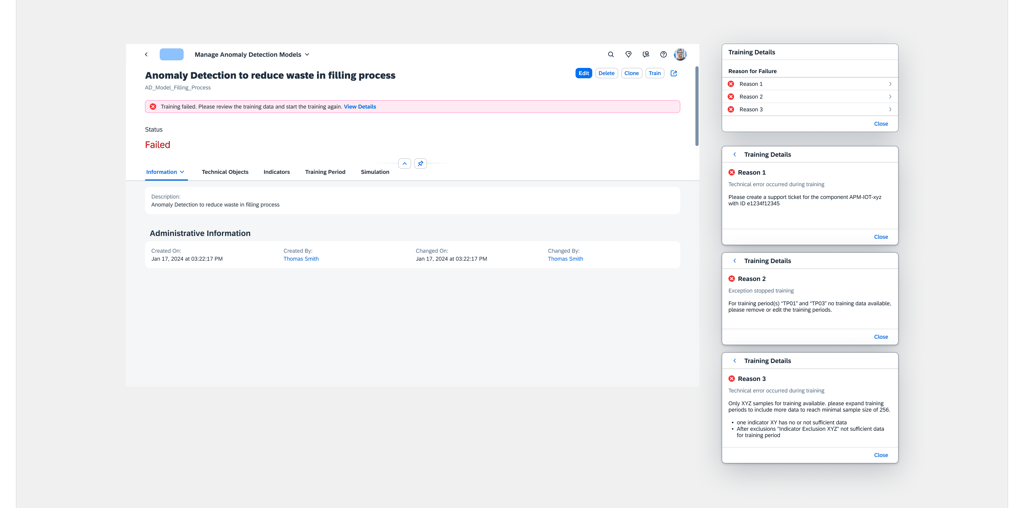
Model Failed
You didn’t come this far to stop
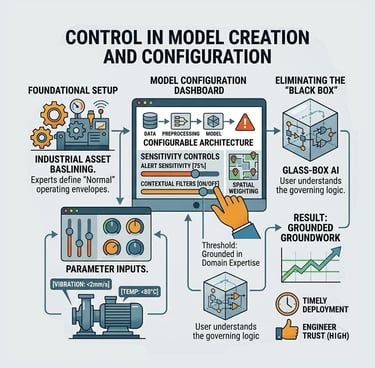
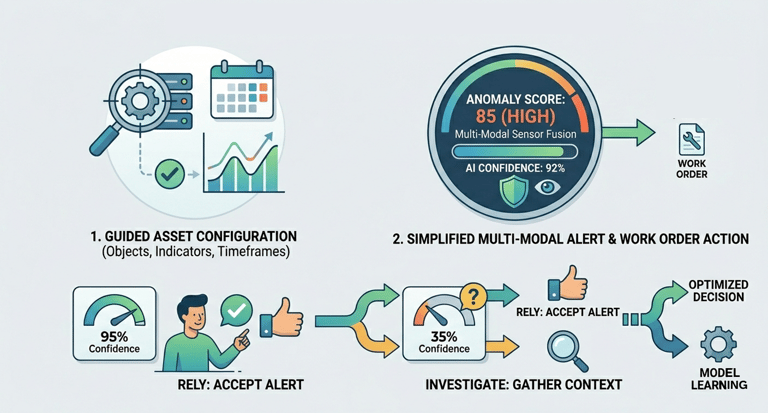
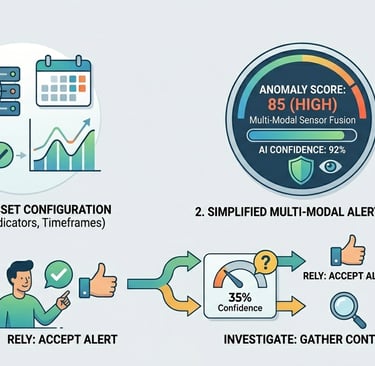
Trust in Decision Review
Actionable Transparency
Designing a Multi-Modal Decision Review UI that fuses all relevant data inputs instantly. The UI must clearly communicate three pieces of critical information: the Anomaly Score, the Prediction Certainty (AI's confidence), and the Context/Impact (why it matters).
Quantifying Trust Calibration, which means users correctly rely on high-certainty predictions and investigate low-certainty ones.
Simulation
The AI is designed to detect statistical anomalies, but the maintenance engineer needs to make operational decisions. Even after a model is trained, it remains a "Black Box" of uncertainty. Without the ability to validate the model's logic or test its limits, the engineer cannot trust the system to act as a reliable guardian of the asset.
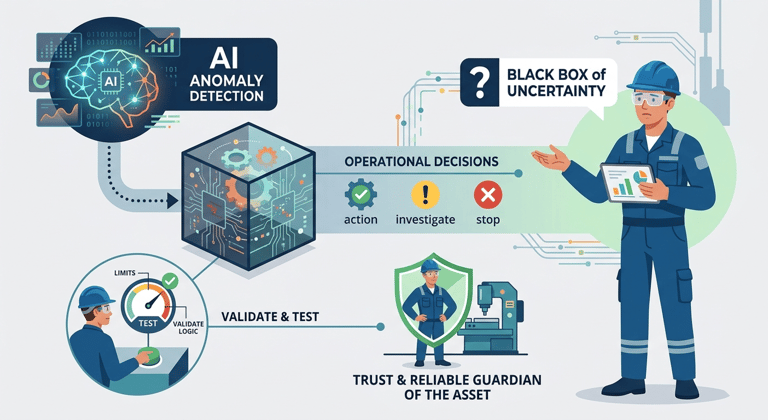
Problem Statement
Pain Points
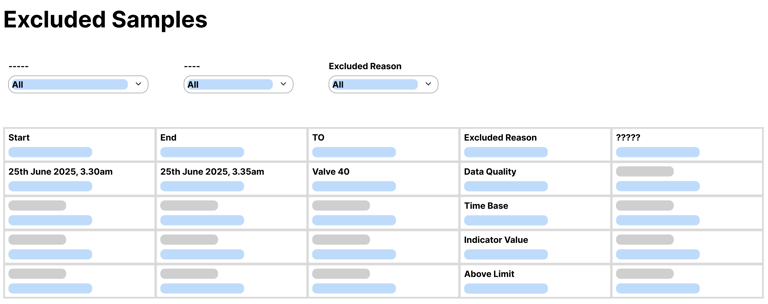
Once training is complete, there is no way for the user to verify if they used the right data. Users are left wondering: "Is this data sufficient, or am I missing the specific sensor that actually signals a failure?"
The "Optimal Data" Mystery
The "Utility" Doubt:
A trained model doesn't prove its worth until it sees an anomaly. This creates a dangerous period of doubt: "Is this model actually useful, or will it miss the very anomalies it was built to find?"
Defining the "optimal" alert threshold is a guessing game. If it's too sensitive, it creates alarm fatigue; if it's too loose, it misses critical failures. Users lack the tools to simulate and balance these thresholds before going productive.
The Threshold Tug of War:
There is no "glass box" view to see which sensors contributed to an alert. Without this, engineers cannot verify the AI's findings against their physical expertise.
Inability to Validate:
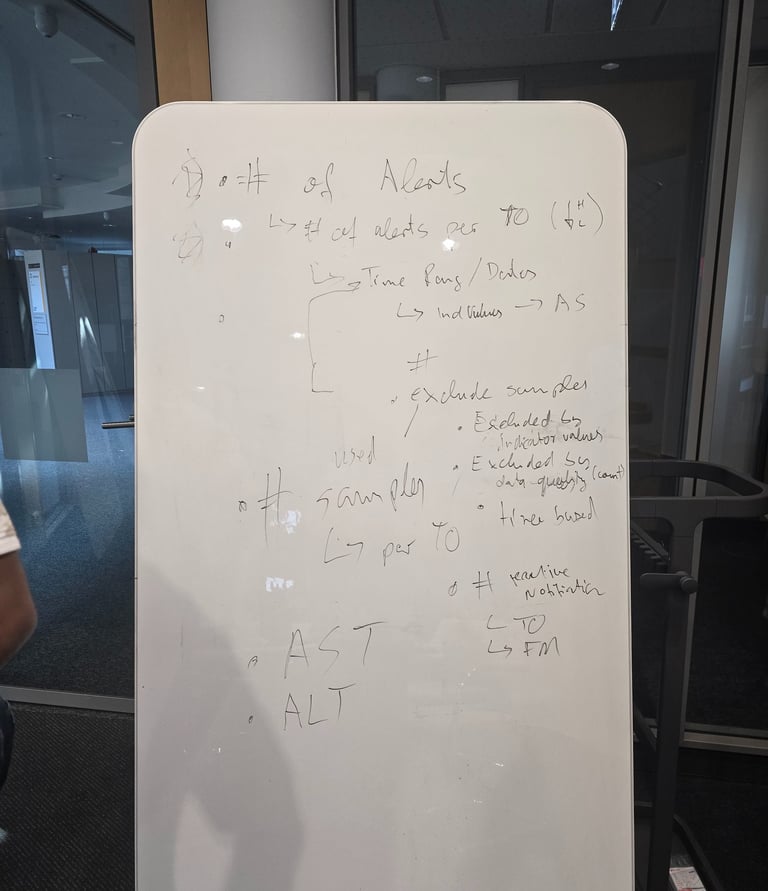
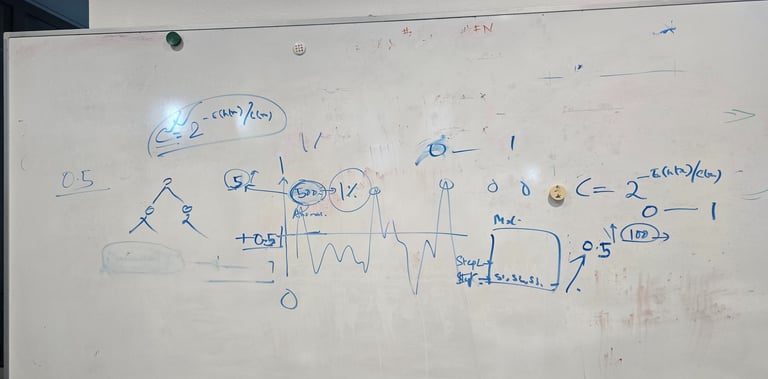
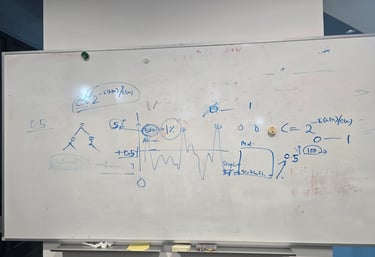
Whiteboarding
Lorem Ipsum is simply dummy text of the printing and typesetting industry. Lorem Ipsum has been the industry's standard dummy text ever since the 1500s, when an unknown printer took a galley of type and scrambled it to make a type specimen book.


Hypothesis A
After training completed, user needs to validate training data details, to see if Anomaly Detection model has been trained with the right/optimal data to detect anomalies.

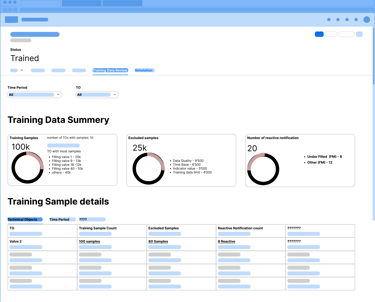
What can go wrong
User defines in training period(s) to less data (but more then the minimal sample size) => AD model could perform insufficient on new data
Exclusions by indicator value (unknown effect) leading to little data
Exclusions by time (semi known effect) leading to little data
Exclusion by data quality issue (e.g. caused by irregular data ingestions)
User defines in training period(s) with to much data but the system can process on some of it. Some training periods are not or only partly represented in training data
Data from relevant TOs (e.g. TOs which user can use to validate AD model performance)
Data contains no or to less contaminated data (data with notifications)
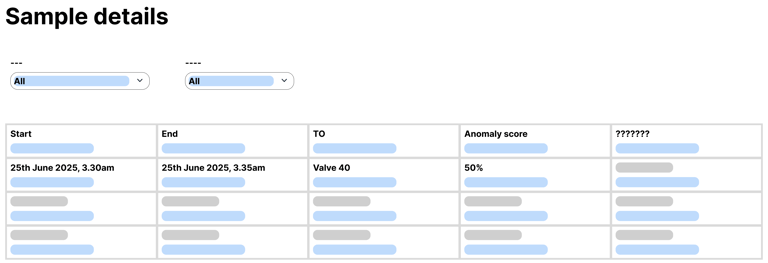
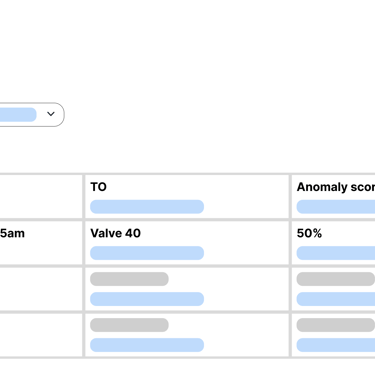
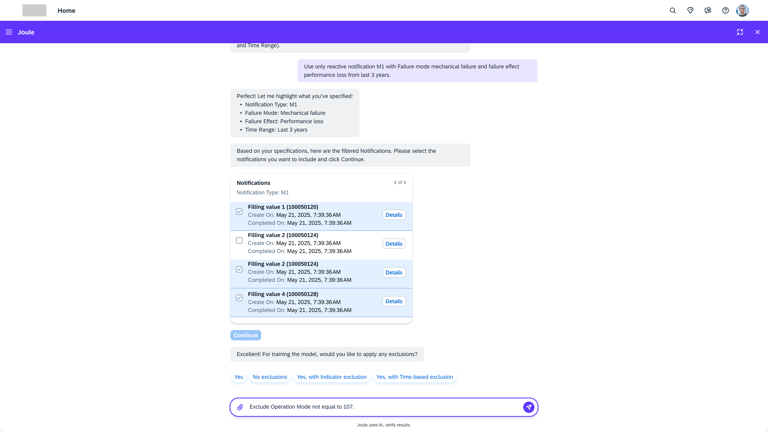
Hypothesis B
User can validate Anomaly Detection model on historical data (training data) by comparison of simulated alerts with notification or knowledge of issues in the past (by date and technical object).
User can assess alert within a certain date range (of notification date) and categorize as useful/good or useless/false alert.
User can tune anomaly score and alert thresholds to adjust the alerts to tune it to his/her expectations.
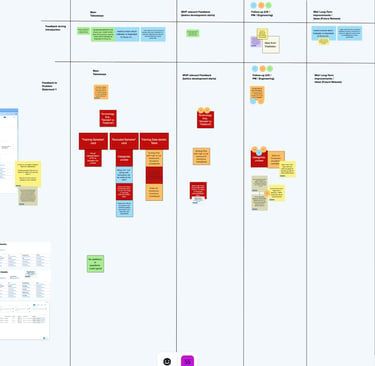
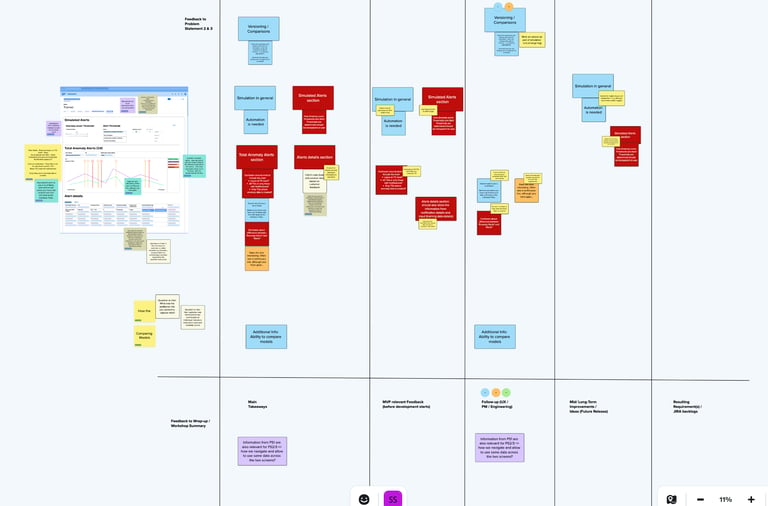
Research interview and Insights
To validate the Problem Statements and initial wireframe mockups for the next phases (review and simulation) of managing anomaly detection models, to ensure ease of use and user satisfaction while using the app.
Goal
Expectation
The results of this workshop will clarify the Problem Statements and whether the mockups fulfill the initial expectations of the users. With this information we will be able to better improve the solution we’re planning to build.
Feedback Prioritize

During user testing, this feature was rated as one of the most valuable additions. Engineers noted that being able to see what the model was learning and how it decided to trigger an alert completely changed their perception of the system. By offering the flexibility to adjust thresholds based on real-world risk, we helped users build stronger, more reliable models that they actually trust to run in production.
Based on the feedback we have prioritized the short term, mid term and long term improvements.
Finial Design
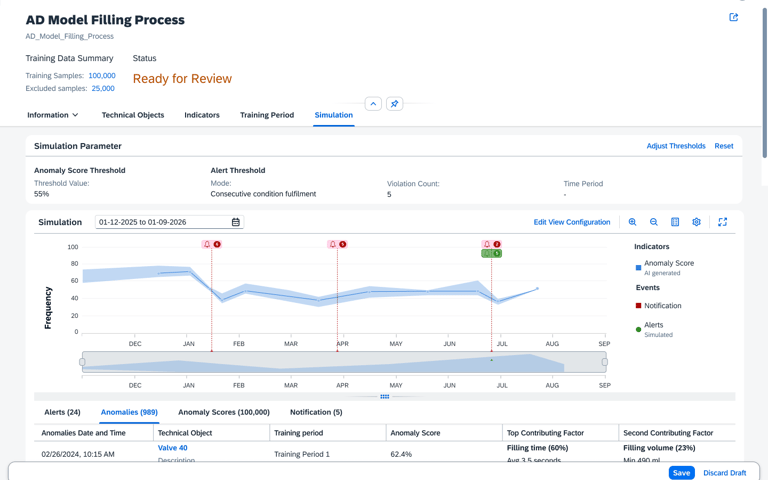
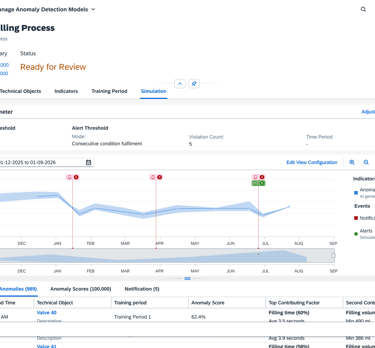
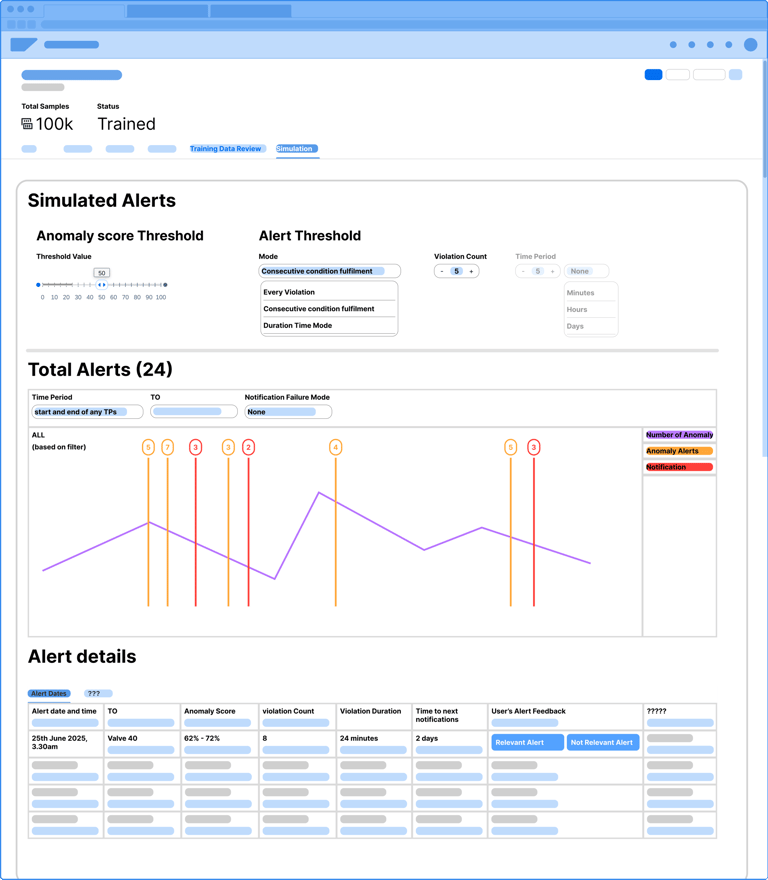
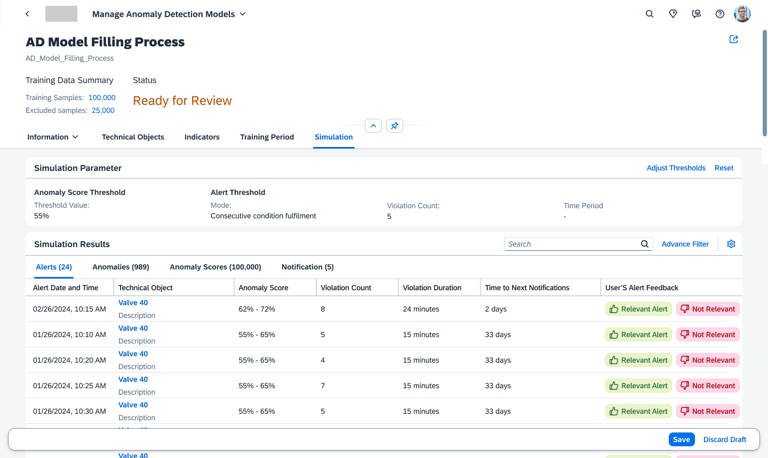
The Simulation screen transforms the AI from a "Black Box" into a transparent, historical sandbox. By overlaying anomaly scores onto a timeline of past events, engineers can perform a "Ground-Truth" check, seeing exactly how the model would have reacted to known historical failures. This visual correlation, supported by detailed tabs for specific sensor factors like Filling Volume, allows users to validate the AI's reasoning against their own real world experience.
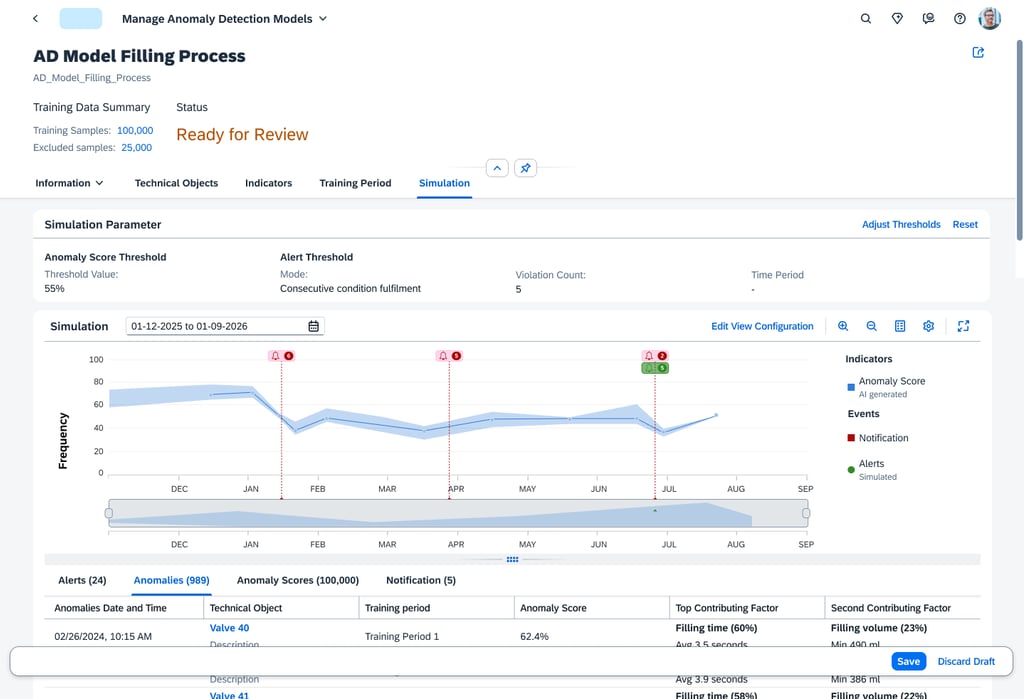
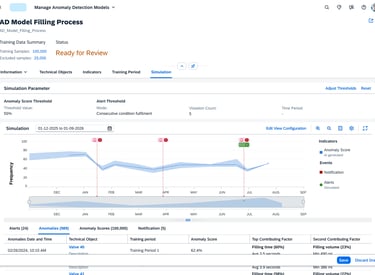
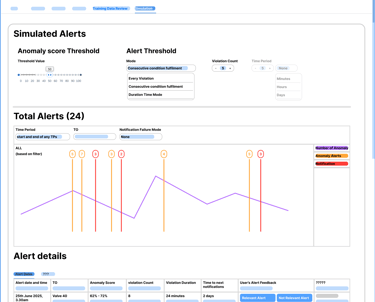
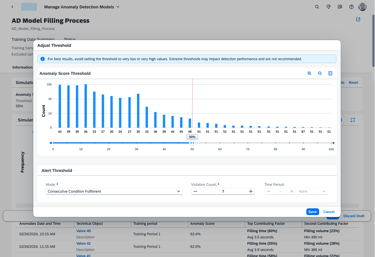
Threshold configuration
The Adjust Threshold tool gives the engineer the "steering wheel" to tune the AI’s sensitivity. By using the histogram to visualize alert frequency, users can set precise rules—like requiring seven consecutive violations—to catch critical failures while eliminating alarm fatigue. This ensures the system acts as a reliable filter, not just a noise generator.

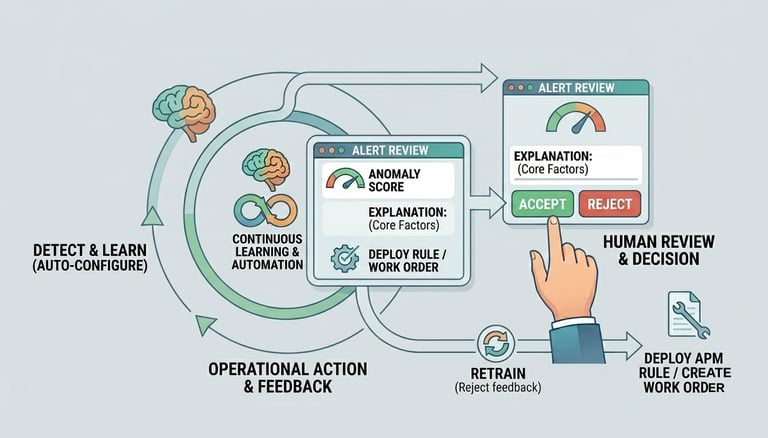
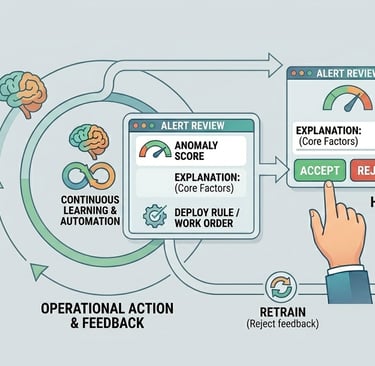
Automation &
Continuous Learning
Human-in-the-Loop
Defining simple Human-in-the-Loop actions (e.g., a single "Accept/Reject" button) for real-time feedback that seamlessly trains the model. This theme also standardizes the experience into a clear, three-part hierarchy for all alerts: Prediction, Explanation, and Action.
Simulation
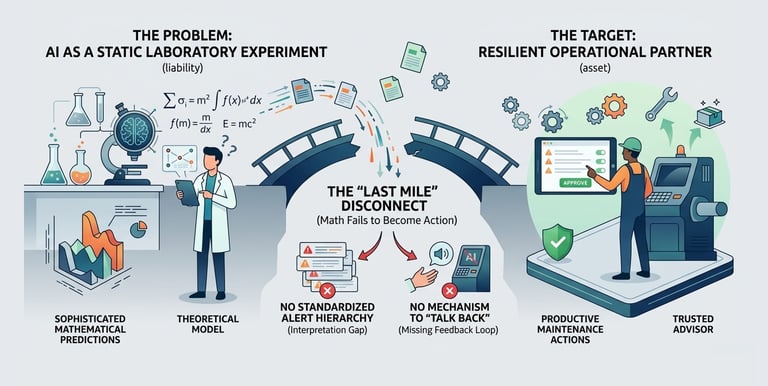
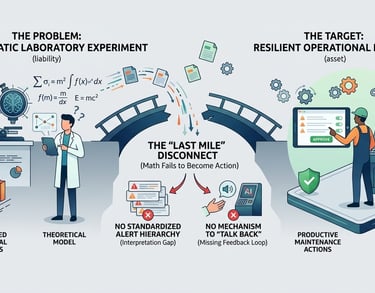
AI remains a static laboratory experiment rather than a resilient operational partner.
Even the most accurate AI model is a liability if it cannot be translated into a business decision. Currently, there is a "Last Mile" disconnect where sophisticated mathematical predictions fail to become productive maintenance actions. Without a standardized hierarchy to interpret alerts or a mechanism for experts to "talk back" to the system
Problem Statement 3
Pain Points
Because retraining is often a manual, technical hurdle involving complex data re-selection, models are rarely updated. They quickly become obsolete as the asset ages or operational conditions change.
The "Static Model" Trap:
Information Overload:
Alerts are often presented as raw data or complex scores without context. This forces engineers to spend valuable time "investigating the AI" rather than fixing the machine.
There is no simple way for a user to provide a "Human-in-the-Loop" verdict. If an engineer identifies a false alarm, that knowledge isn't captured, forcing the system to repeat the same error indefinitely.
The Missing Feedback Loop:
Closing the "Last Mile": Bridging Prediction and Action
To transform AI from a "Black Box" into an operational partner, I designed a standardized alert hierarchy that translates raw scores into actionable metrics like Violation Duration and Urgency. This provides the context needed to turn math into a business decision.
The final bridge is the User Feedback Loop (Relevant / Not Relevant). This mechanism allows experts to "talk back" to the system, overruling or validating the AI. This simple interaction instantly closes the gap between a theoretical prediction and a productive maintenance action, ensuring the model evolves through human expertise.
Simulation
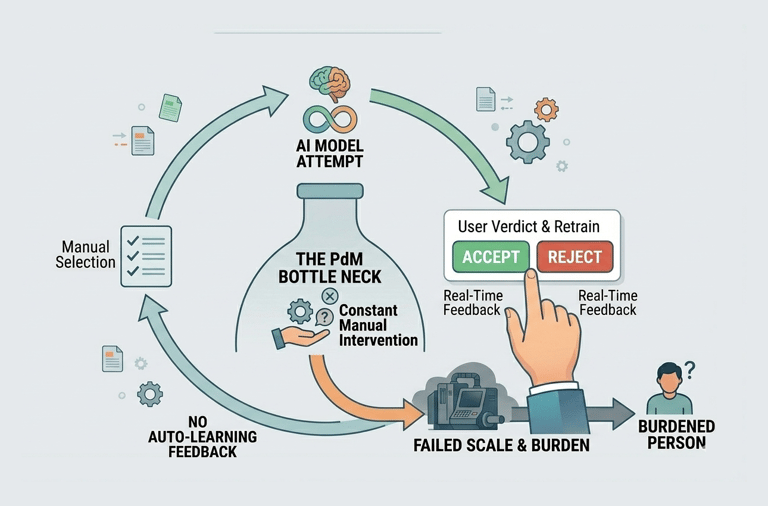
Most Predictive Maintenance projects fail because they are "high-maintenance." To keep a model accurate, a human usually has to manually intervene: re-selecting hundreds of sensors and identifying specific historical dates for "healthy" data. This creates a bottleneck where the AI cannot scale because it requires constant manual reconfiguration.
Problem Statement 4
Pain Points
Manually identifying and grouping relevant Sensor Objects for a specific asset is a tedious, error-prone task that consumes hours of engineering time.
The "Data Janitor" Burden:
The Training Window Guessing Game:
There is no automated way to identify "Gold Standard" historical periods. Engineers must manually scan logs to find stable Training Timeframes, leading to inconsistent model quality.
Because retraining is a manual chore, models are rarely updated. They become "static snapshots" that eventually lose accuracy as the physical asset undergoes repairs or environmental changes.
The "Frozen" Model Problem:
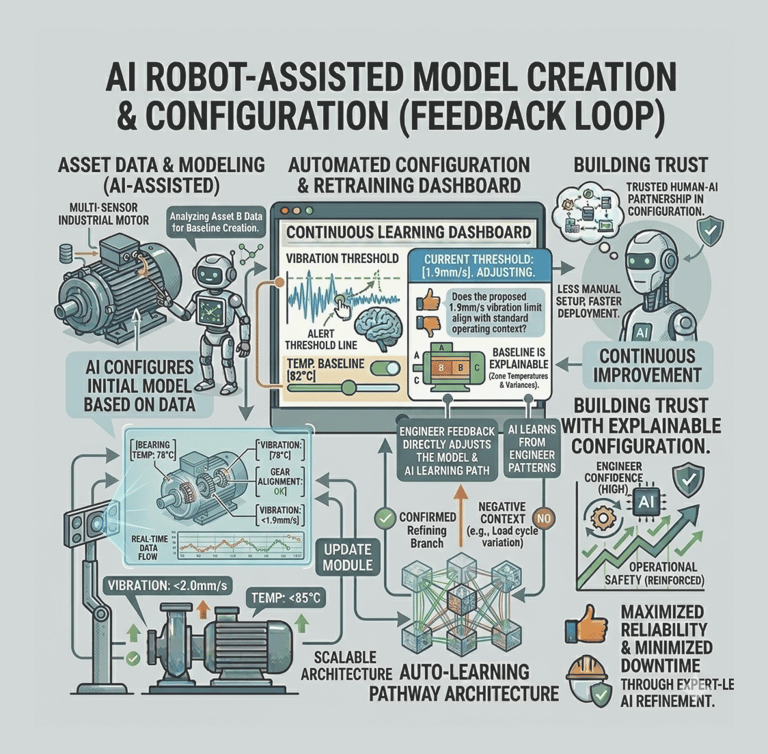
Model creation from Agent AI
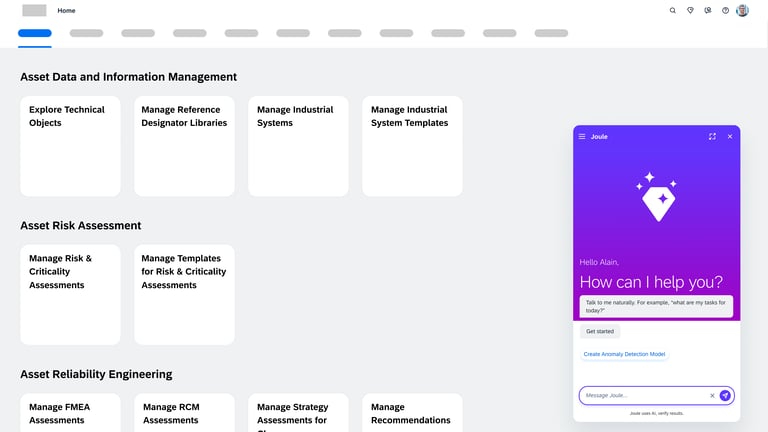


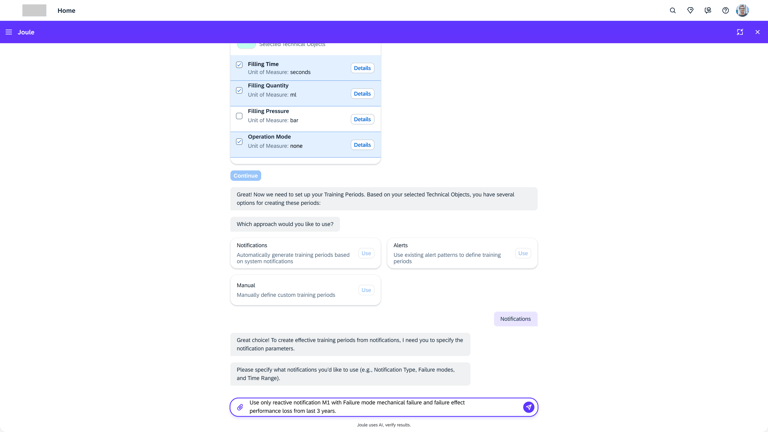
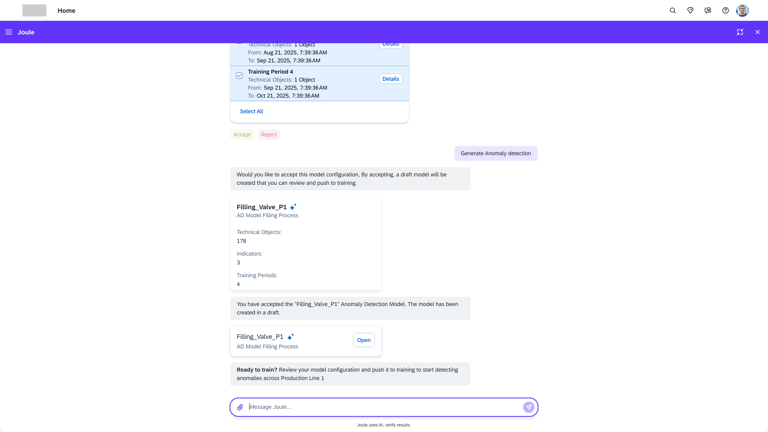
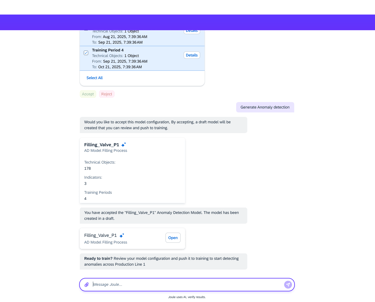
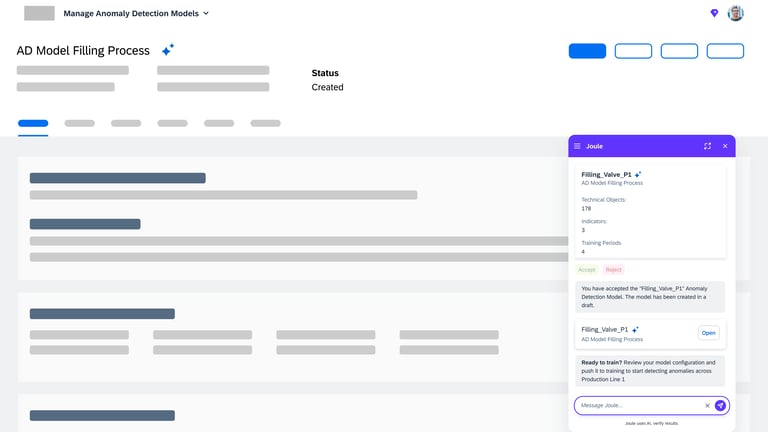
Agentic AI workflow that automates the most labor-intensive parts of model creation. Instead of a human manually re-selecting hundreds of sensors or hunting for "healthy" historical dates, the AI Agent takes the lead.
Intelligent Feature Discovery
Automating the "High-Maintenance" Setup
The agent automatically analyzes and suggests the most relevant technical indicators, removing the "hundred-sensor" bottleneck.
Automated "Healthy" Data Identification
Using historical patterns, the AI proposes optimal training periods, ensuring the model is built on accurate benchmarks without manual intervention.
Conversational Configuration
By moving from complex forms to a guided chat flow, we enable engineers to scale models across thousands of assets quickly, transforming a high-maintenance liability into a self-scaling operational asset.
Final Reflections
While this project continues to evolve, our current phase has successfully laid the groundwork for a more trustworthy and scalable AI future in Asset Performance Management. This journey was far more than a design exercise; it was a masterclass in cross-functional synergy.
I worked intimately with Product Managers, Developers, and Data Scientists to ensure that our UX vision was not only technically feasible but also mathematically sound. Bridging the gap between data science complexity and user-centric simplicity required constant dialogue and shared problem-solving.
To truly understand the "ground truth," I traveled to Germany twice to conduct intensive user research. Sitting side-by-side with the engineers who manage these massive industrial assets provided invaluable insights that no remote session could capture.
Key Takeaways:
Design as a Mediator:
My role was to translate "black box" algorithms into a trusted partner that speaks the same language as the engineers on the ground."
Research is Foundational:
The field visits in Germany underscored that empathy for the user’s environment is the only way to build a truly "resilient operational partner."
Scale requires Trust:
Automation only works if the user feels in control. By designing for transparency, we transformed a "high-maintenance" liability into a scalable business asset.
Thanks for reading!
Interested in AI, Predictiveness, or working together? I’d love to hear from you. Let’s start a conversation.
srinarasimha97@gmail.com